Dashboard User Guide
The Keystone CDP user interface is designed to provide you with a powerful, real-time look into your customer data, segment health, and product attribution metrics.
The Main Dashboard
When you first log in, you are greeted by the main dashboard. This provides a high-level overview of your data ingestion rates, recent events, and key performance indicators.
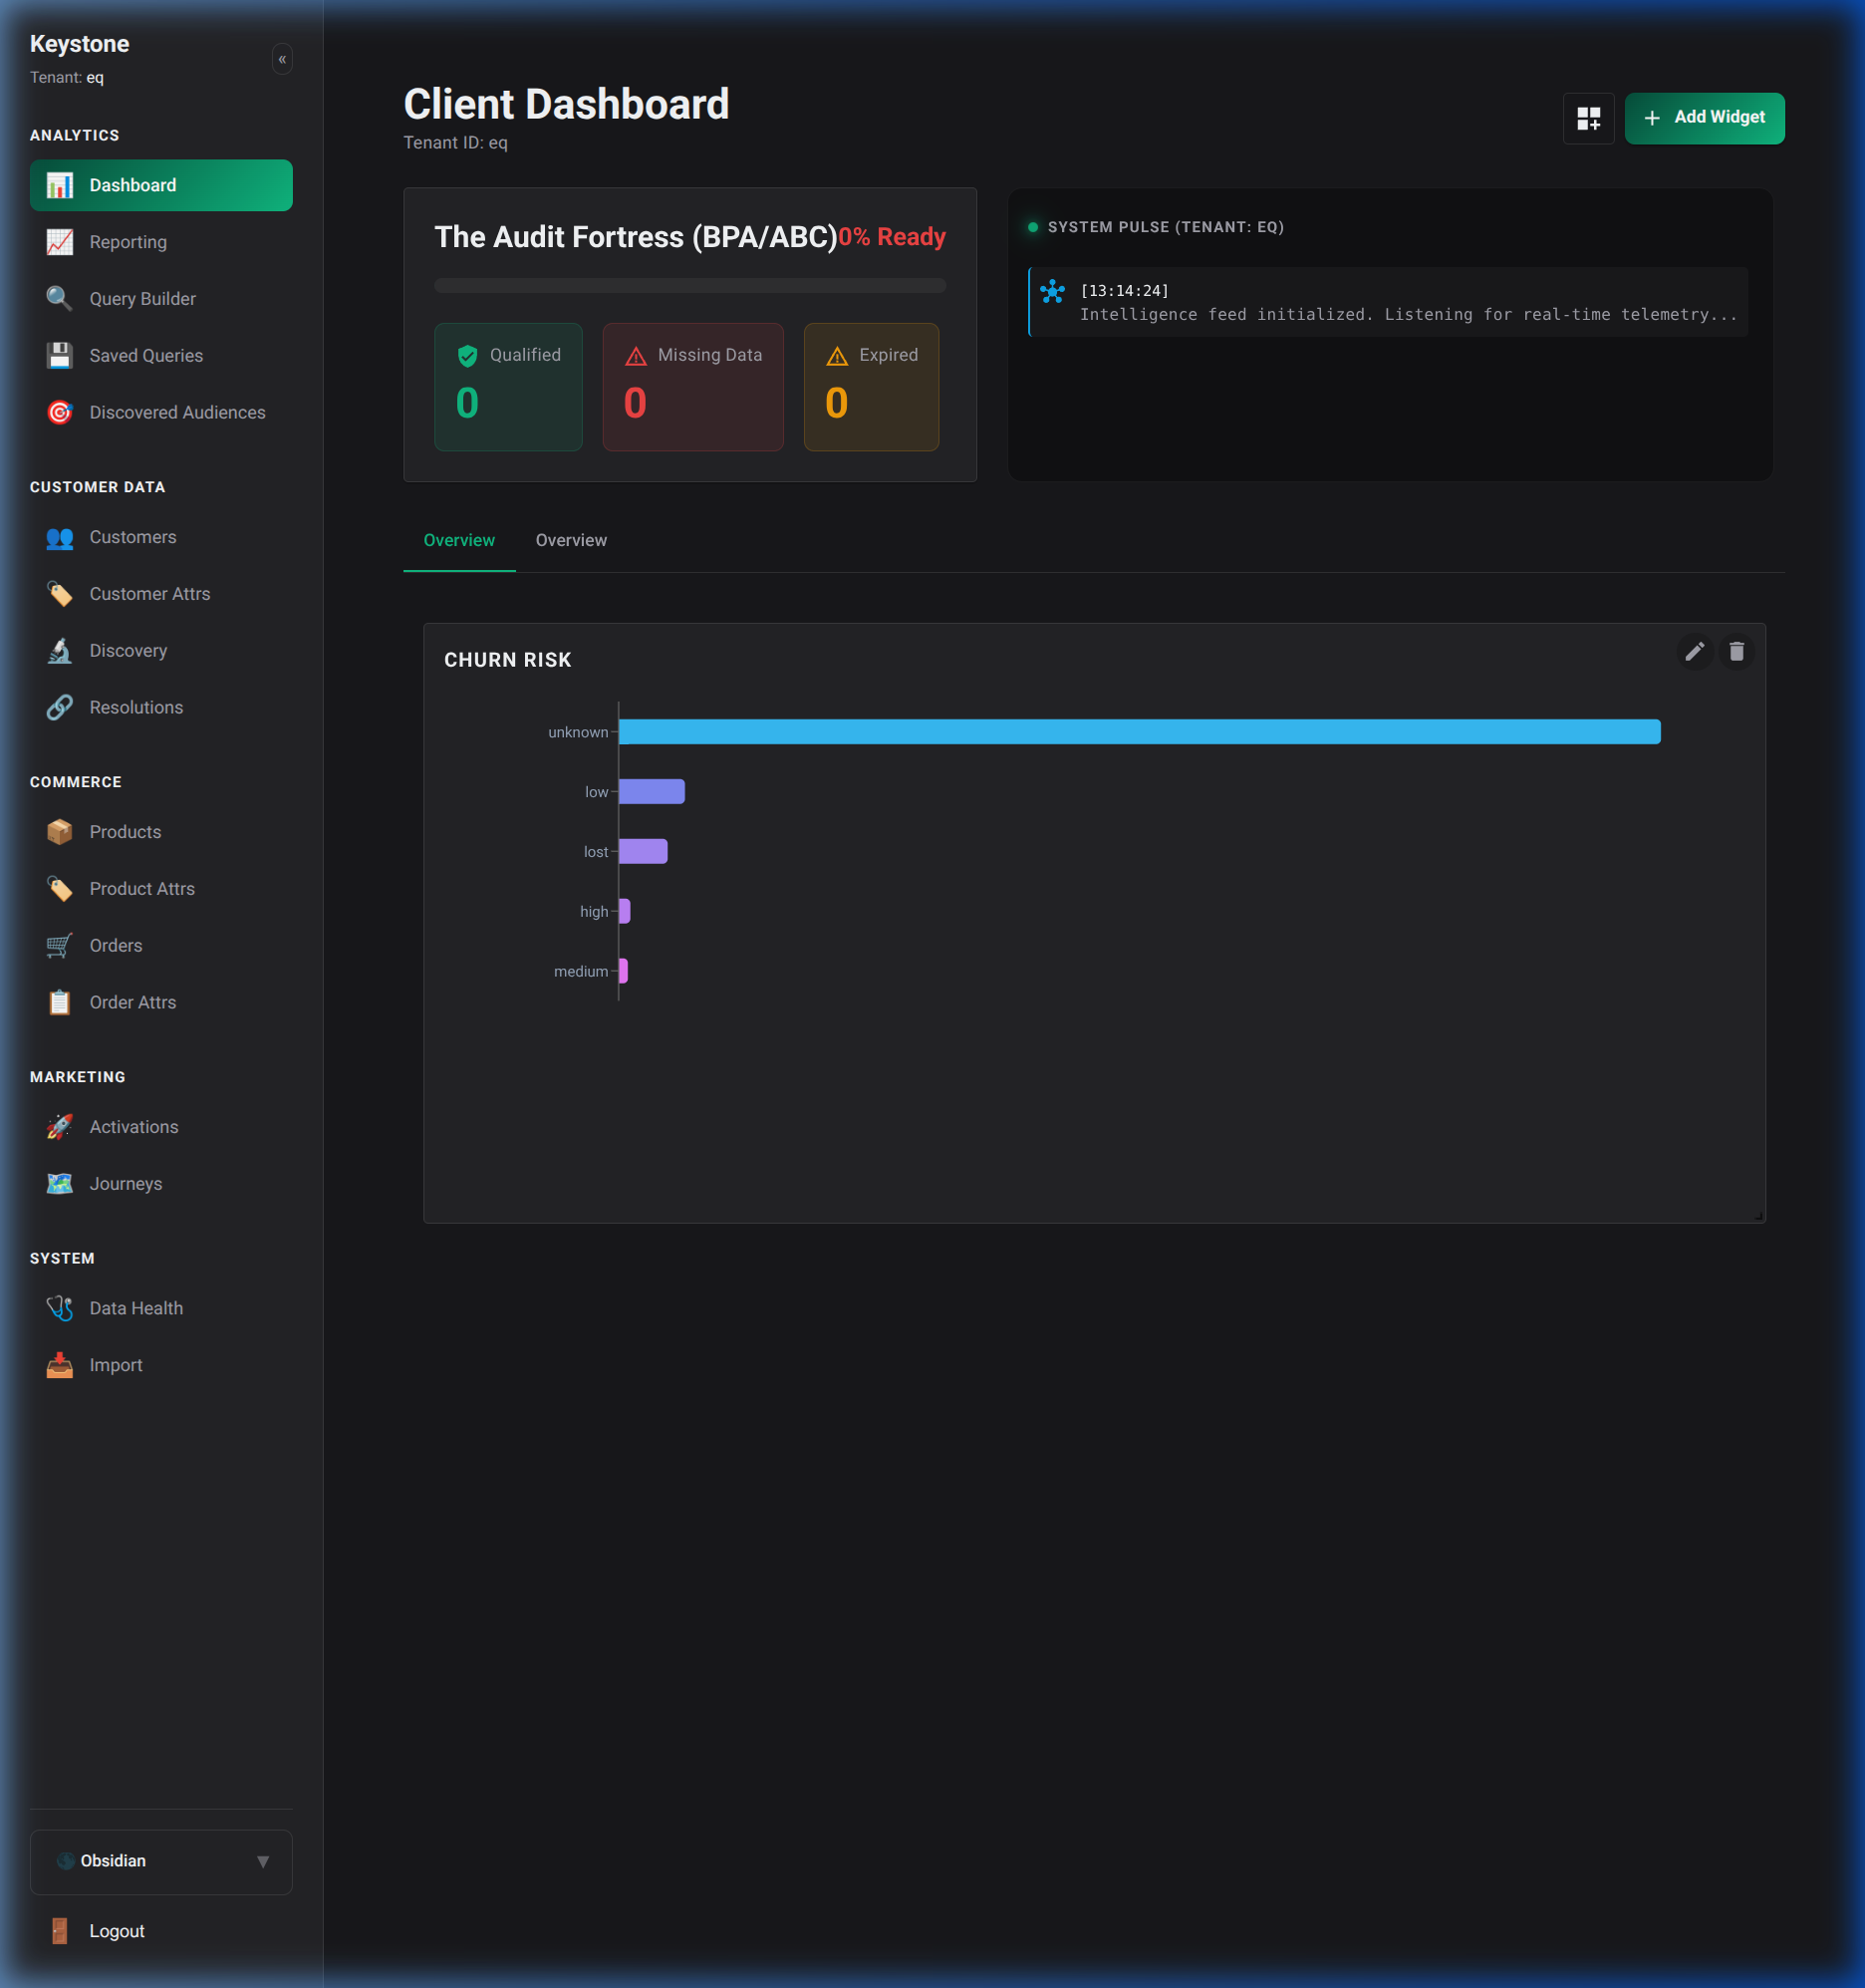
From here, you can quickly navigate to any other section using the primary navigation menu.
Managing Customers
The Customers page provides a sortable, searchable view of all known identities within your database.
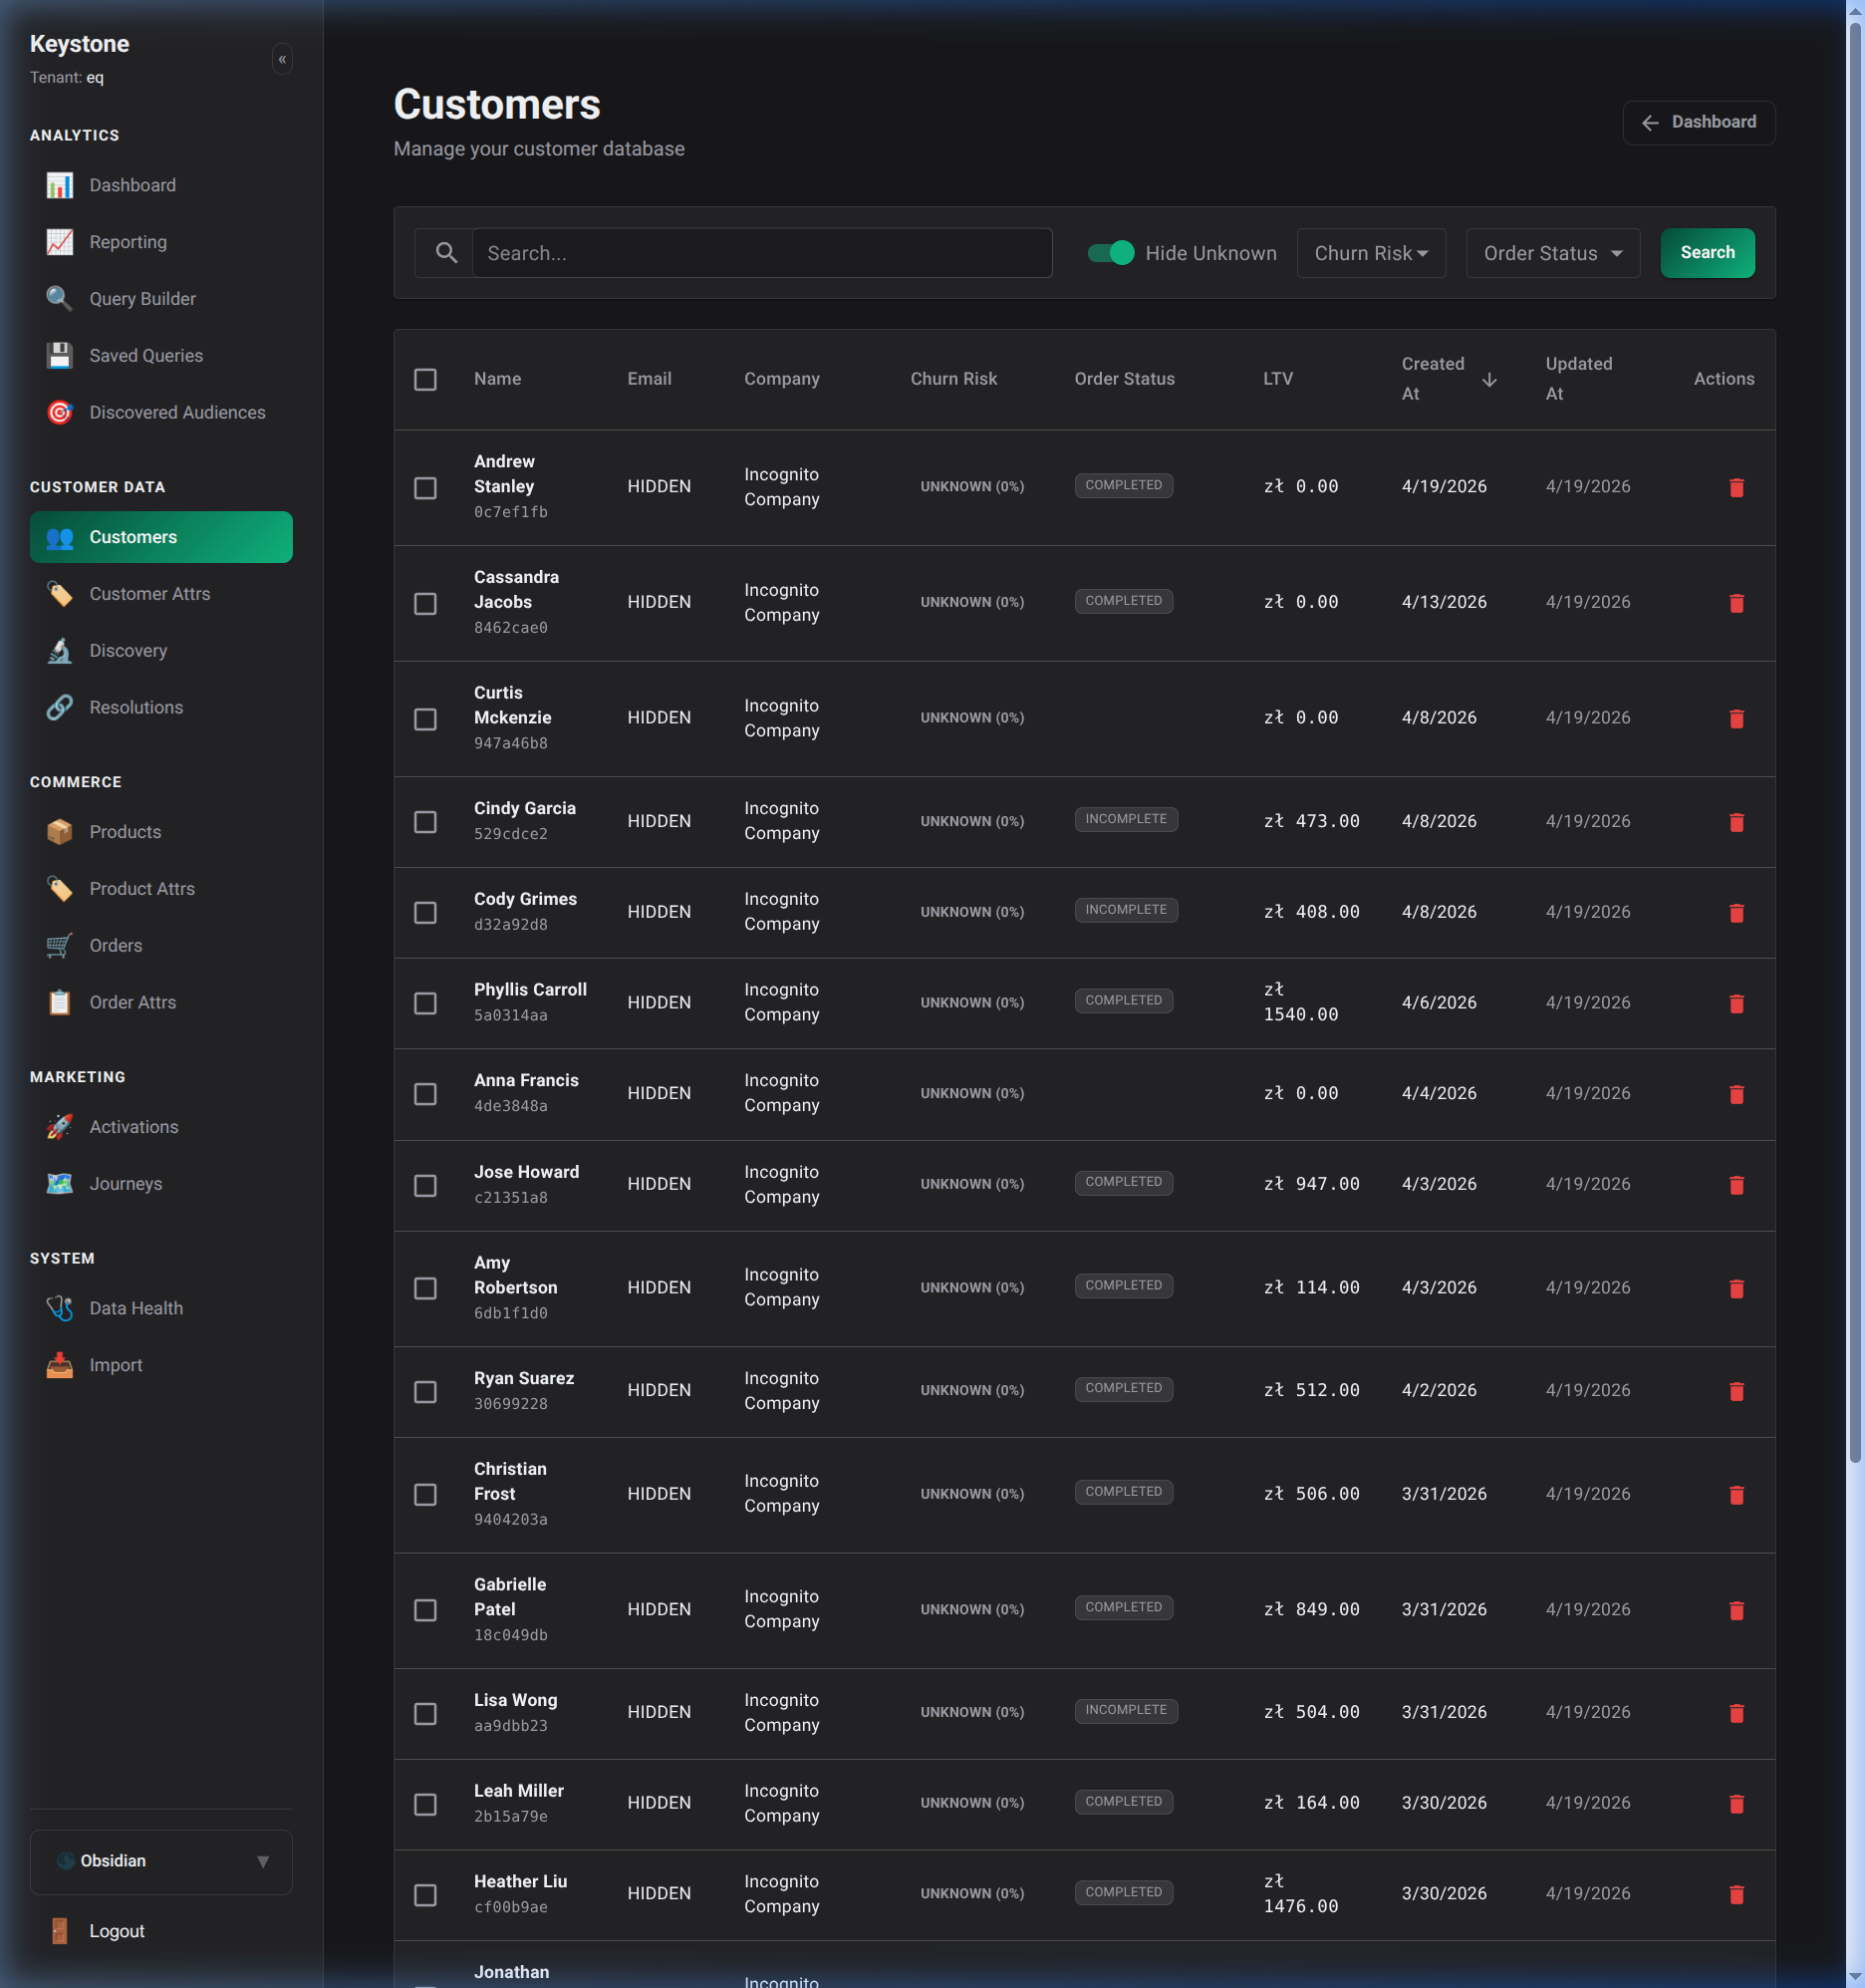
You can click on any row to drill down into a specific customer's profile.
Customer Profiles
The Customer Profile view shows a unified timeline of all events associated with a specific identity.
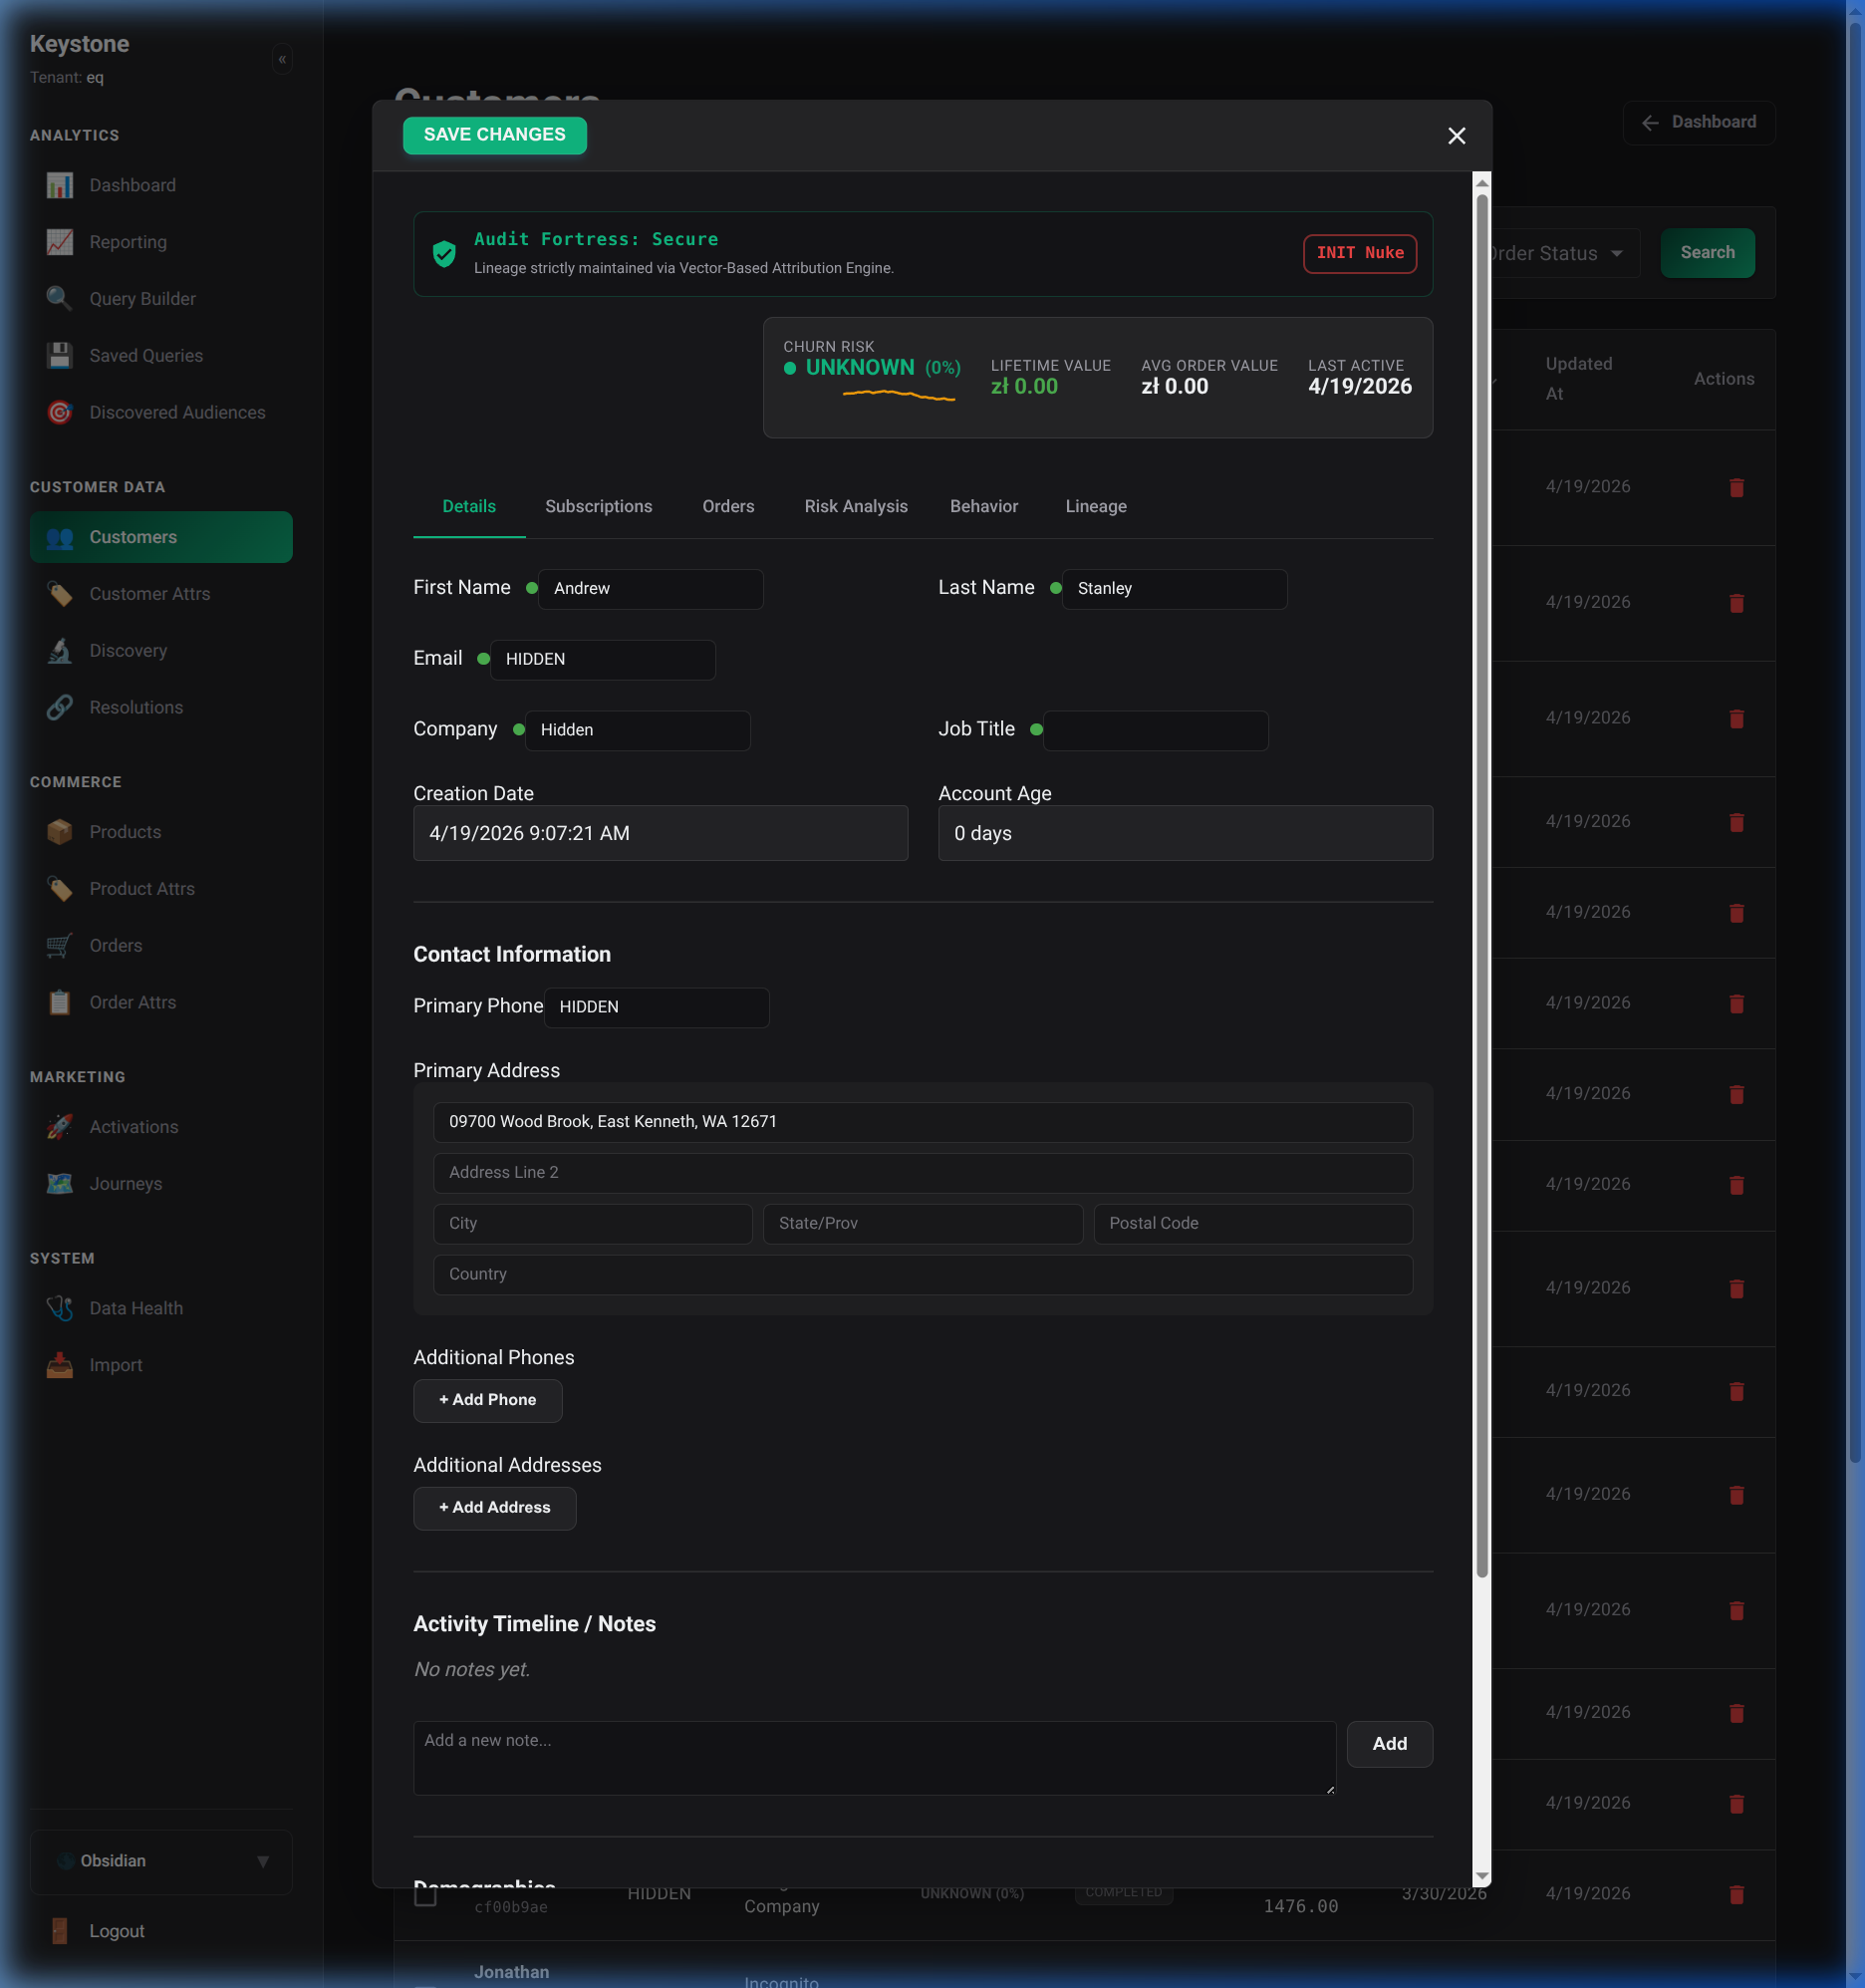
This timeline consolidates events from all your integrated data sources, allowing you to see the complete customer journey.
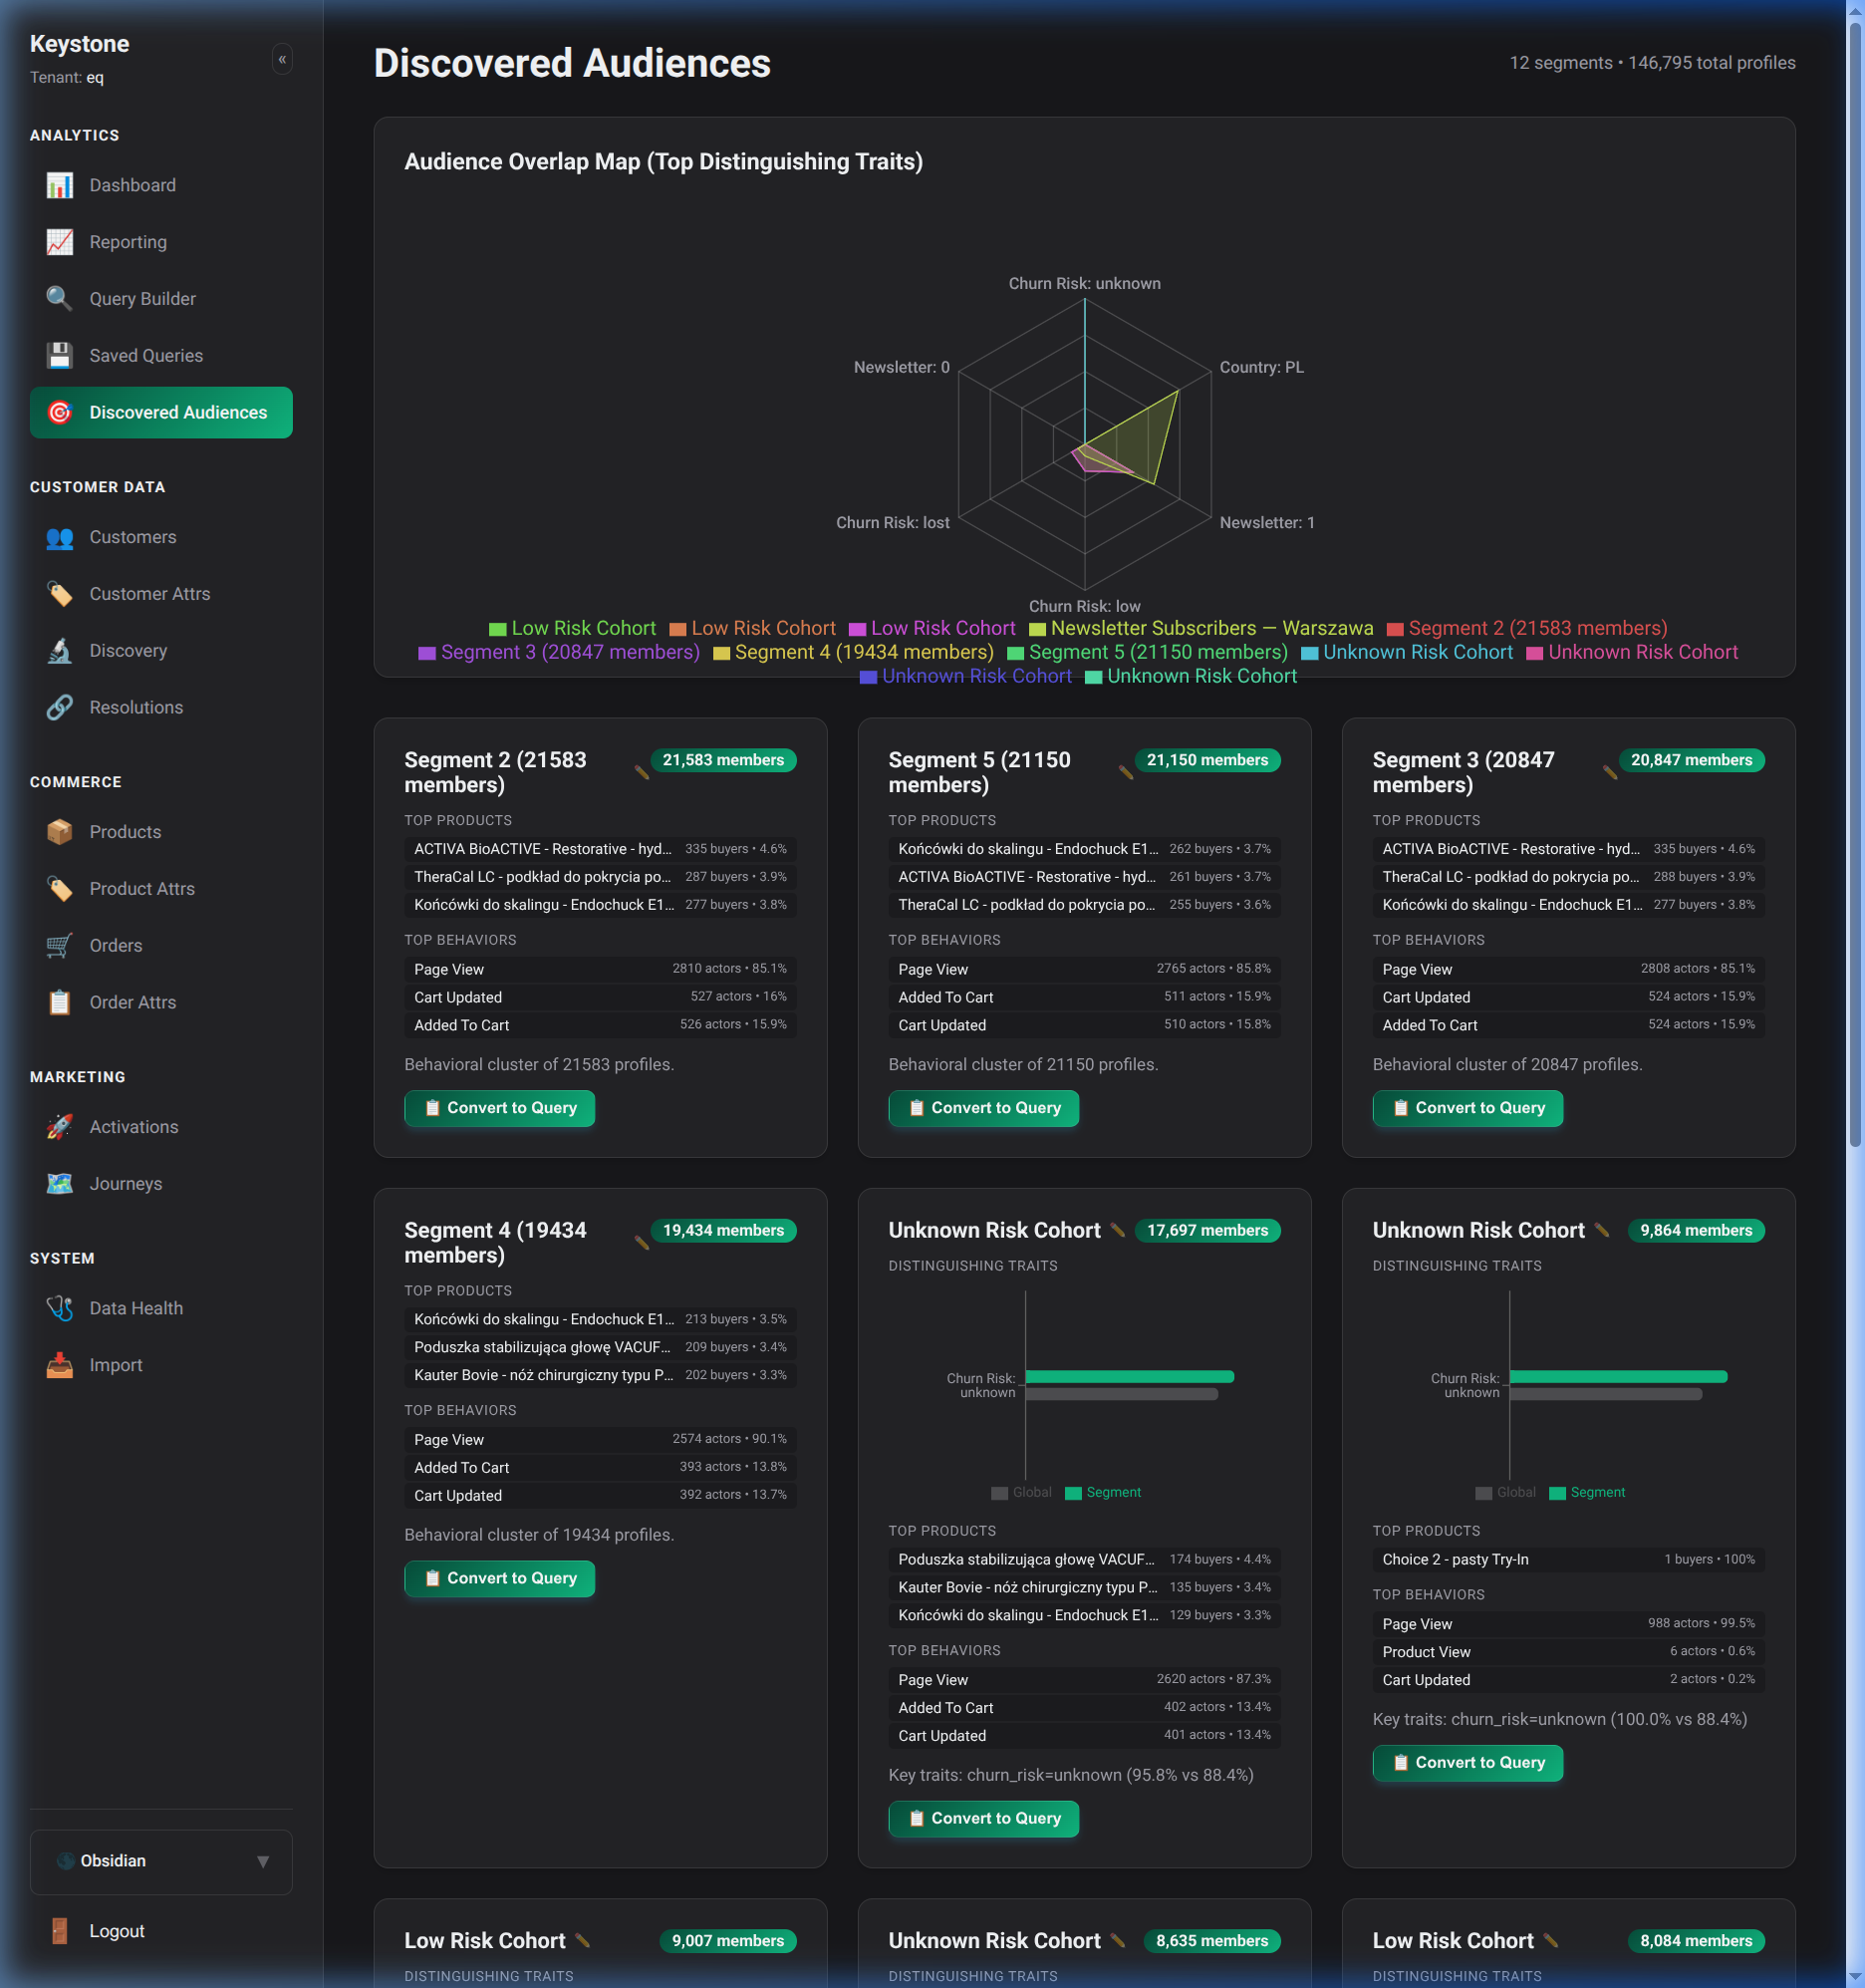
Audience Segments
The Segments page allows you to view dynamic audiences that the CDP has discovered or that you have manually constructed. These segments are updated in real-time as customer behaviors change.
Analytics & Reports
The Reports section offers deep dives into product performance and revenue attribution. Here you can visualize the exact revenue share driven by different products or manufacturers.
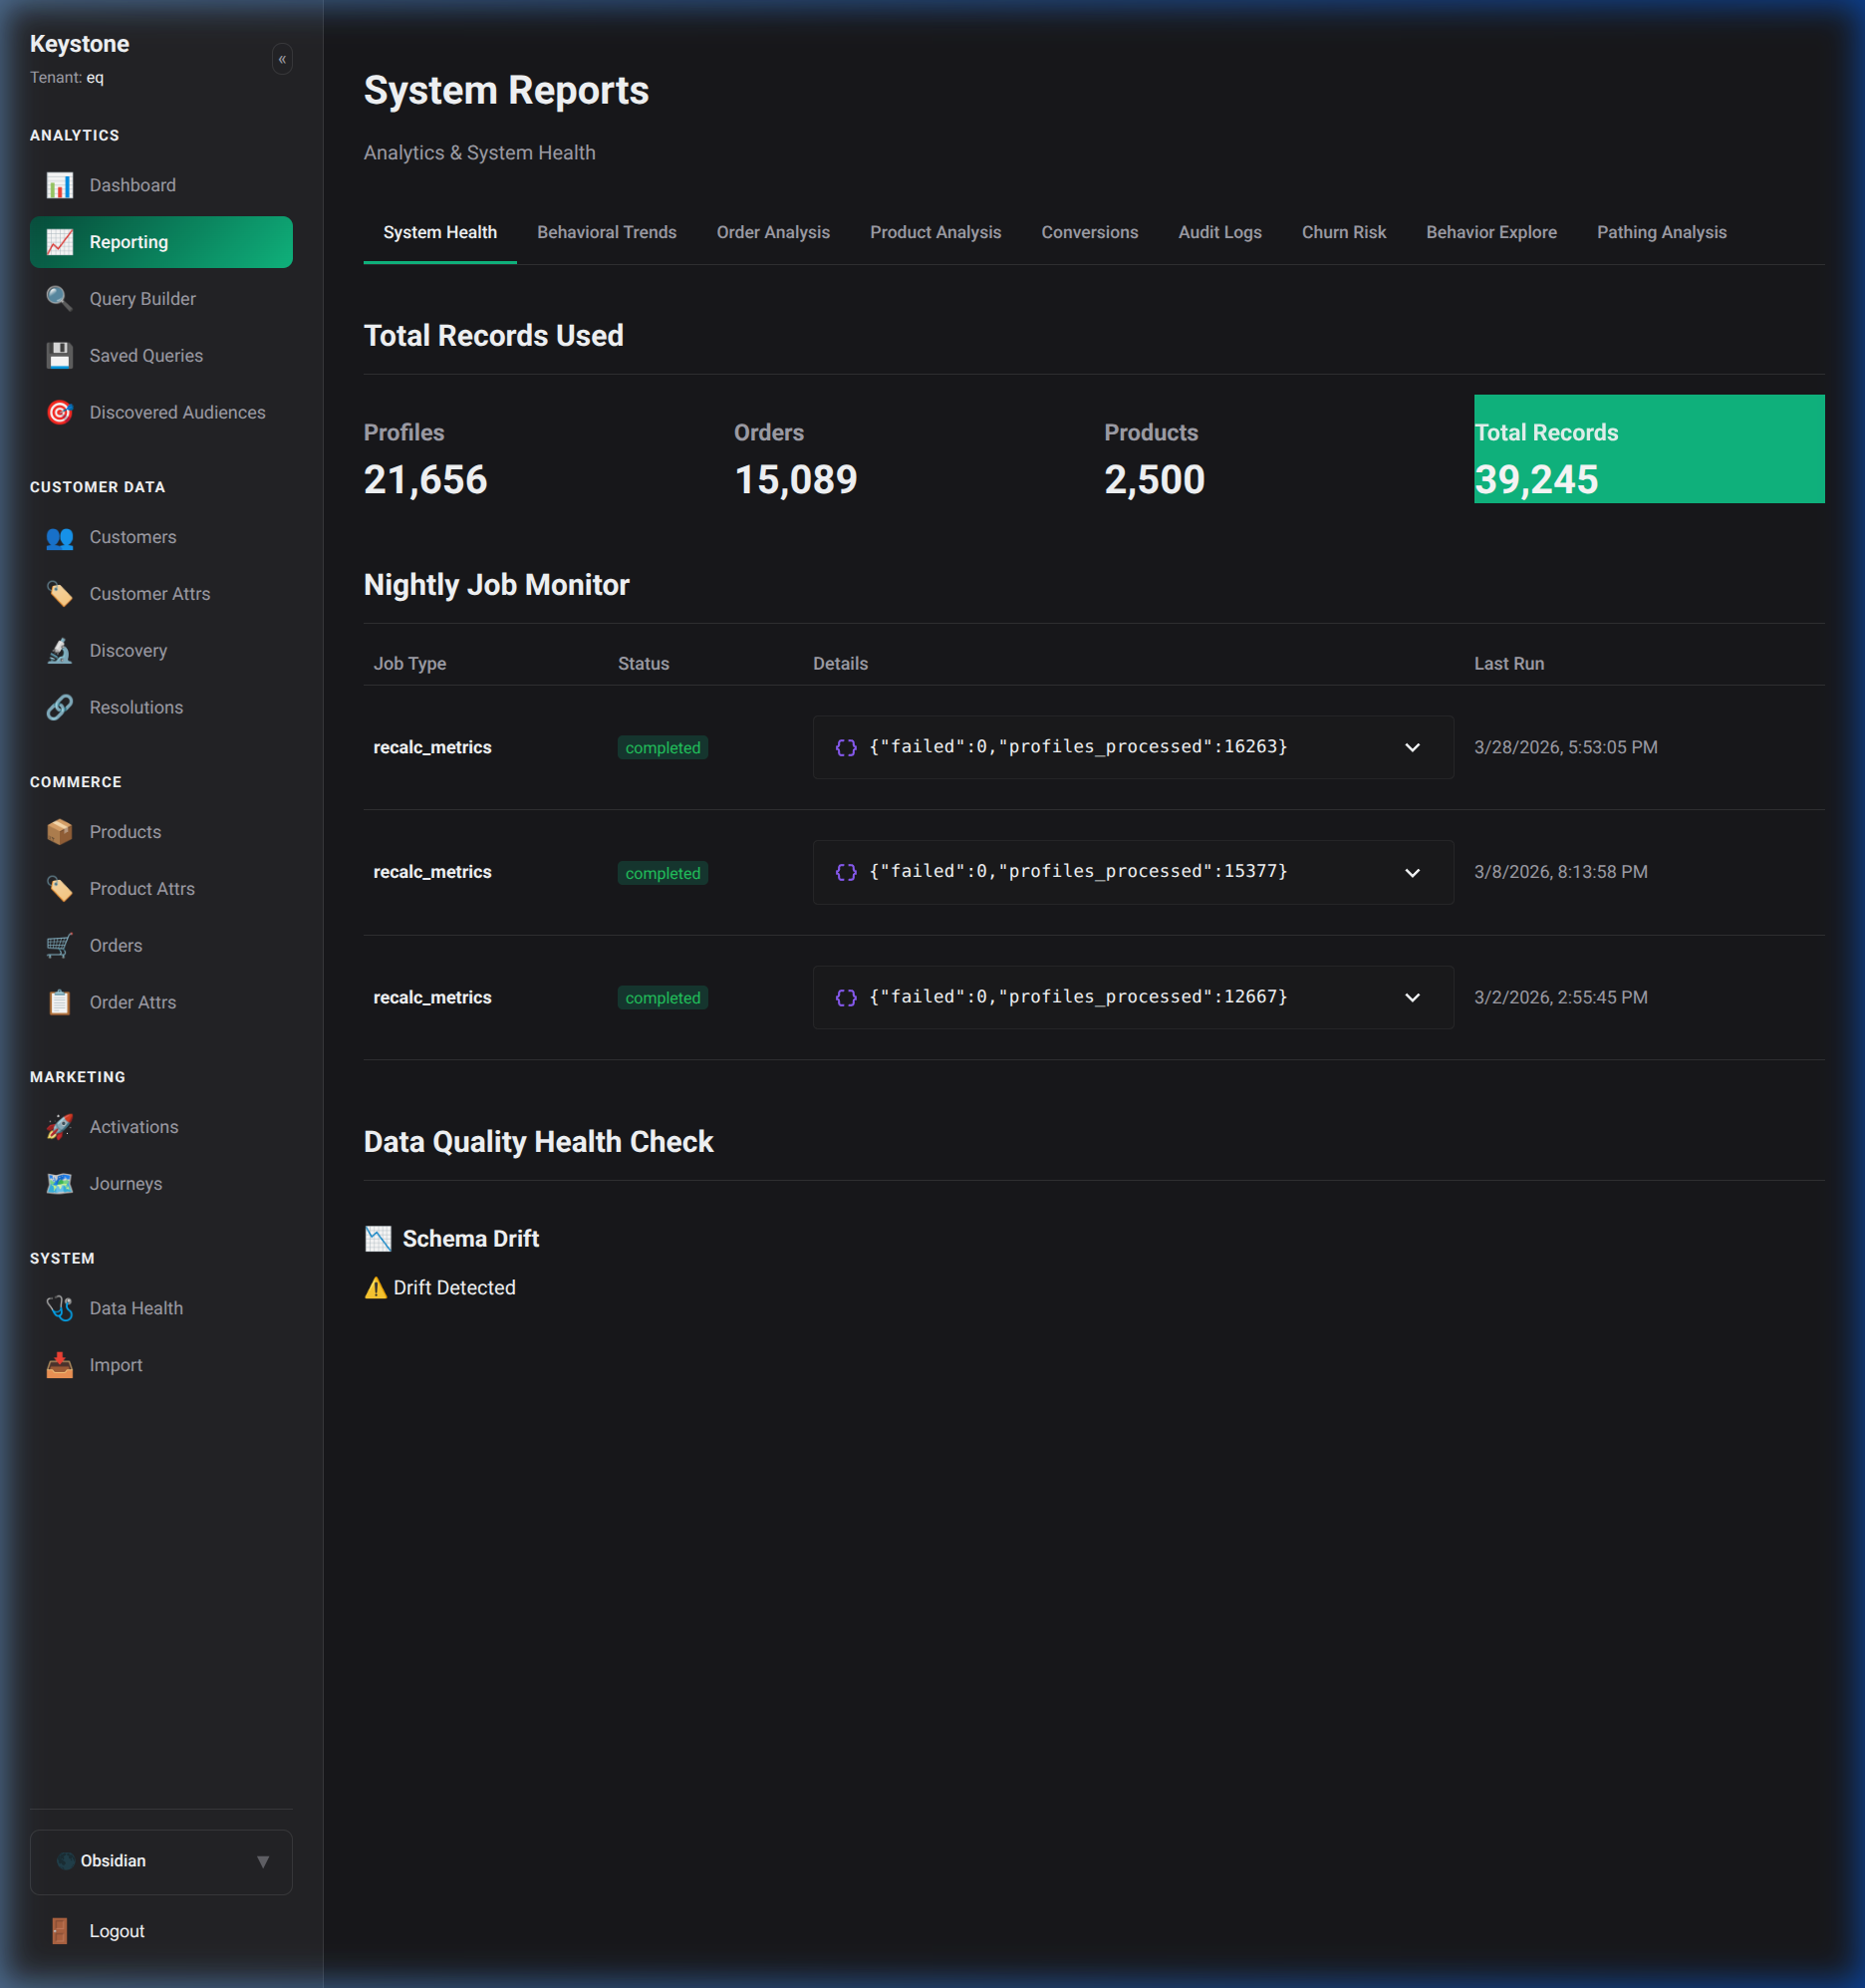
This visual telemetry helps you optimize your marketing spend and product focus based on deterministic and probabilistic data models.