Churn Propensity Scoring & Retention
Acquiring a new customer costs 5 to 7 times more than retaining an existing one. Keystone's Churn Risk Engine computes continuous churn probability scores for every customer, allowing growth teams to intervene with automated retention workflows before the customer is lost.
1. The Churn Risk Dashboard
Navigate to Analytics -> Churn Risk (/analytics/churn-risk) to inspect customer risk distributions and decay patterns.
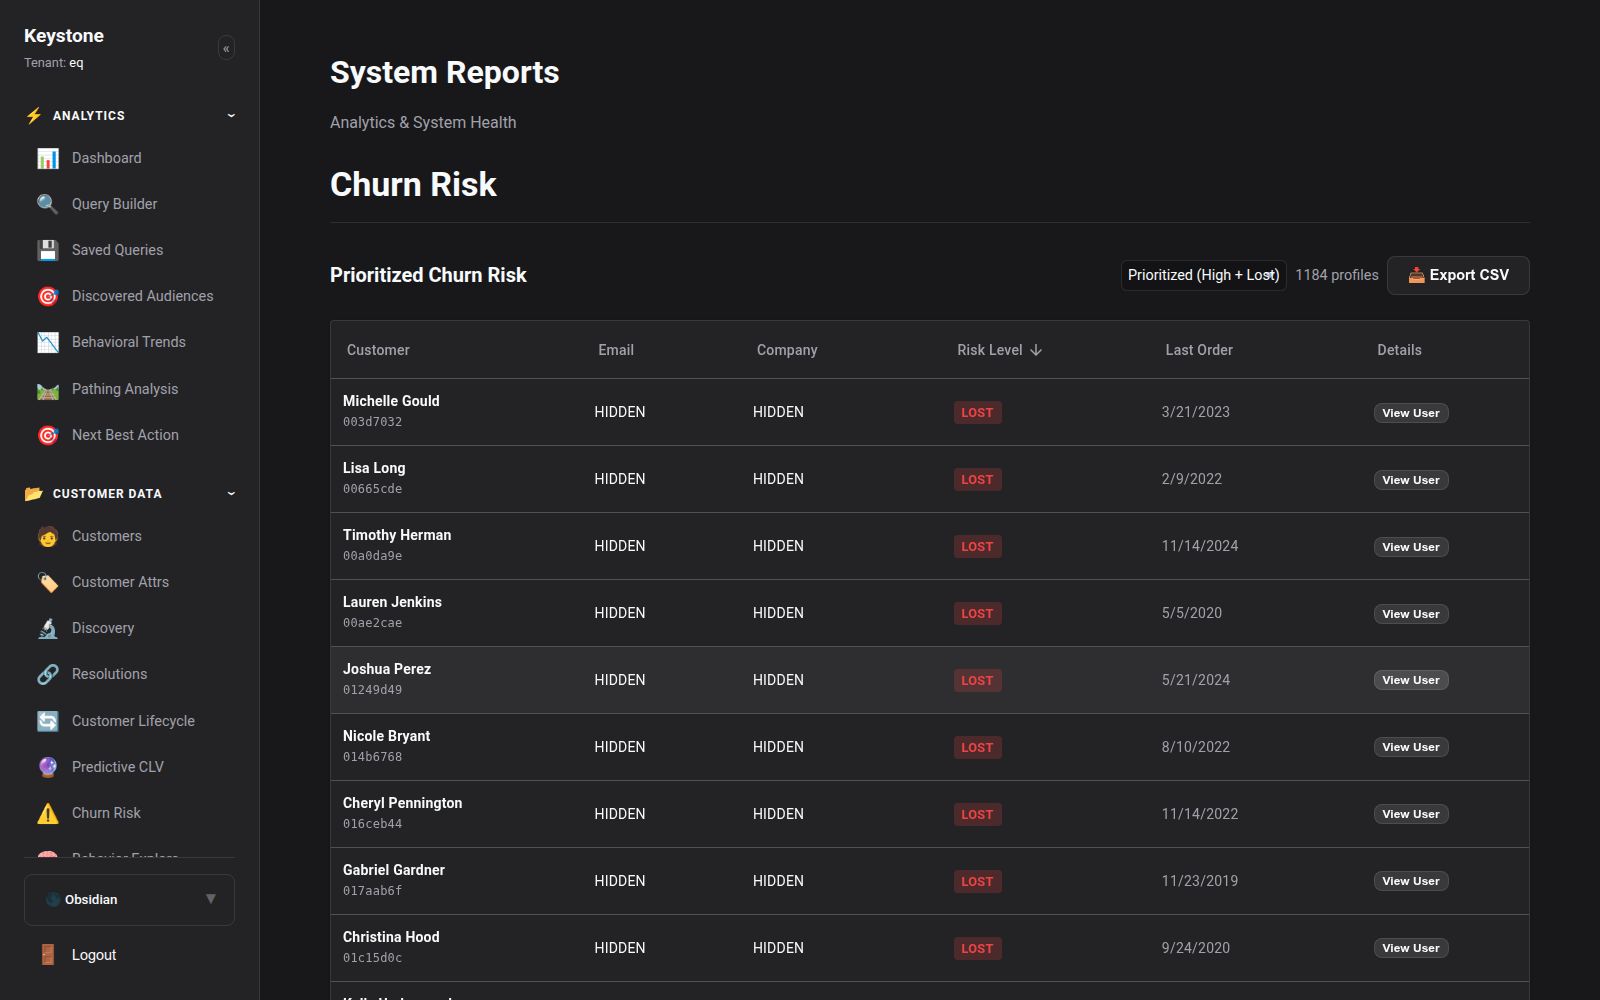
Click to enlarge
Key Display Metrics:
- Total At-Risk Revenue: Aggregate historical spend of customers whose churn risk score exceeds
0.70. - Mean Churn Probability: Overall risk rating across the customer base.
- Risk Distribution Tiers:
- Low Risk (0.00 - 0.30): Engaged, frequent shoppers with stable cadence.
- Medium Risk (0.31 - 0.70): Showing early warning signs of disengagement.
- High Risk (0.71 - 1.00): Severe drop in engagement; imminent attrition.
2. Multi-Factor Churn Modeling
Unlike simplistic rules (e.g. "hasn't purchased in 60 days"), Keystone's churn scoring takes into account personalized purchasing cycles:
- If Customer A normally purchases once every 14 days, a 30-day absence indicates High Churn Risk.
- If Customer B normally purchases once every 180 days, a 30-day absence indicates Low Churn Risk.
Leading Churn Indicators Monitored:
- Inter-Purchase Interval Deviation: Mathematical distance between the current elapsed days and the customer's personal historical purchase interval.
- Browsing Velocity Decay: Sudden decline in website sessions, product views, and newsletter opens.
- Cart Abandonment Ratio: Repeated cart updates without completed checkout.
- Customer Support Signals: Unresolved support tickets or negative sentiment surveys.
- Subscription Payment Retries: Failed card transactions or dunning events.
3. Automated Retention Triggers
Connect churn risk directly to automated intervention journeys:
graph TD
    Monitor[Continuous Churn Scorer] --> Check{Churn Score > 0.70 & Historical LTV > $300?}
    Check -->|Yes| Segment[Enter 'VIP At Risk' Segment]
    Check -->|No| Safe[Remain in Standard Cohort]

    Segment --> Flow[Automated Customer Journey]
    Flow --> Step1[Send Personalized Check-in from Founder/Concierge]
    Flow --> Step2[Wait 3 Days]
    Flow --> Step3{Completed Order?}
    Step3 -->|No| Step4[Deliver High-Value Exclusive Incentive]
    Step3 -->|Yes| Exit[Exit Segment & Lower Churn Score]
Best Practice Retention Playbooks:
- Exclusive Re-engagement Offer: Deliver a limited-time incentive tailored to their preferred product category.
- Surveys & Feedback Requests: Ask why they stopped purchasing to gather qualitative operational insights.
- Audience Suppression: Suppress high-churn, low-value customers from expensive paid social re-targeting ad sets.