Audience Segmentation & Lifecycle Matrix
Keystone's Audience Segmentation engine allows growth marketers and data analysts to construct real-time, dynamic cohorts based on behavioral events, demographic traits, RFM matrix scoring, and predictive machine learning models.
The Customer Lifecycle & RFM Matrix
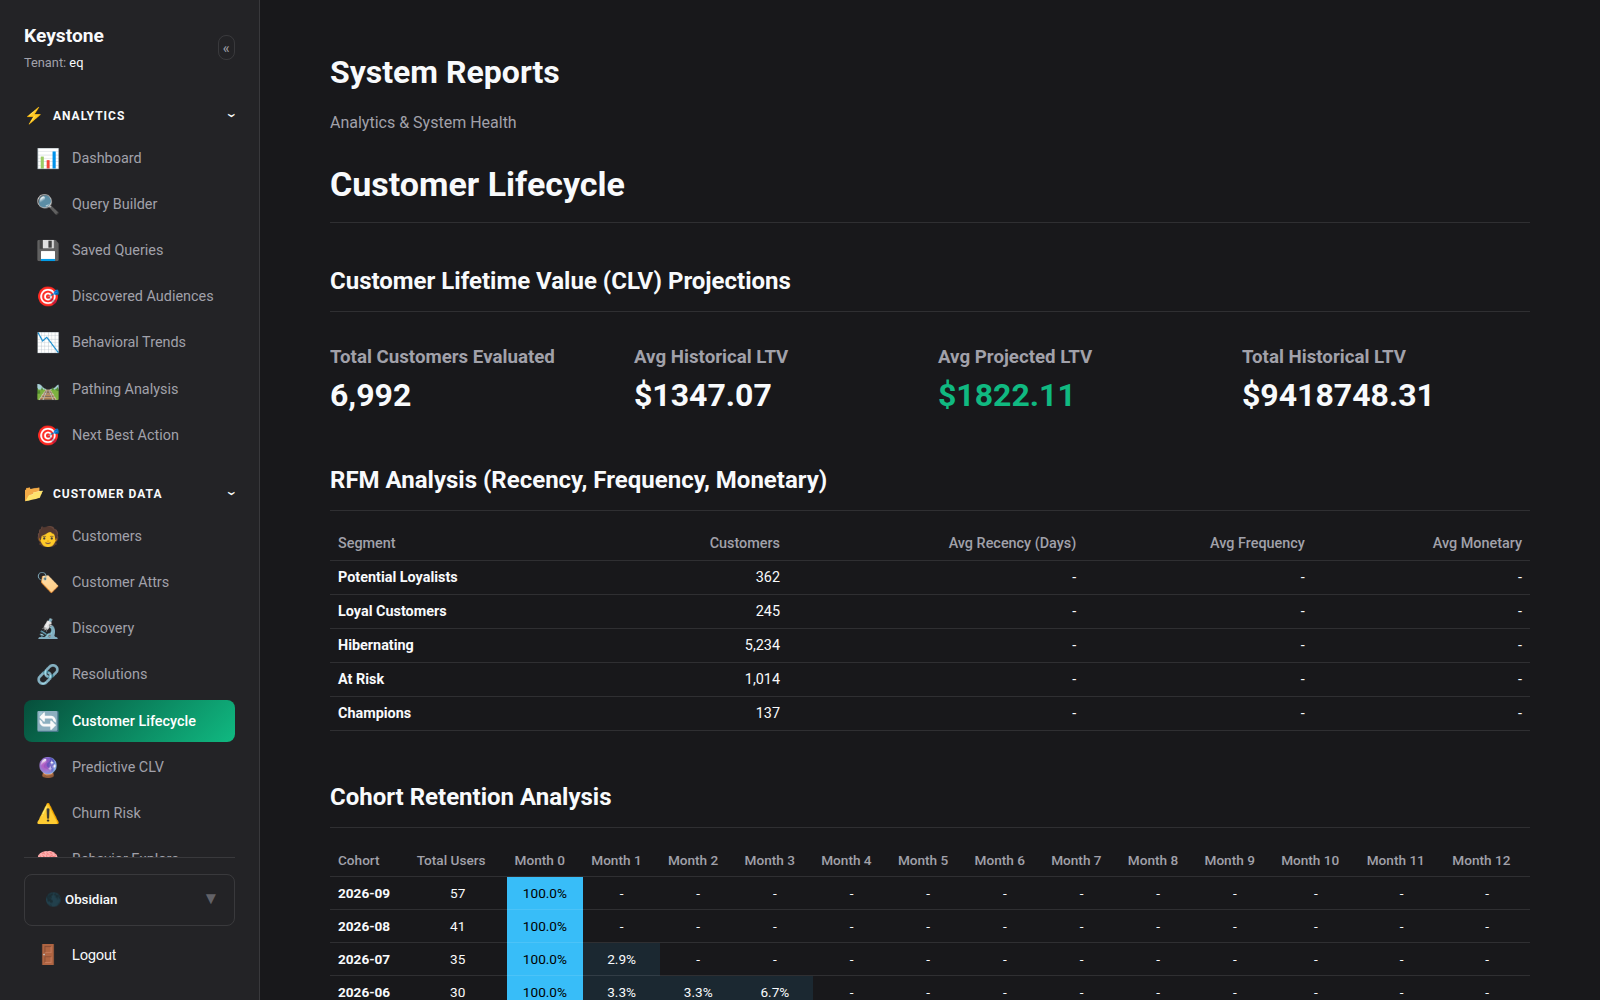
Navigate to Analytics -> Customer Lifecycle (/analytics/lifecycle) to visualize the comprehensive health of your entire customer base.
Click to enlarge
Key Executive Metrics:
- Historical Value: Total gross revenue generated across the customer cohort (e.g.
$9,418,748.31). - Projected LTV: Mean machine-learning forecasted 12-month value per customer (e.g.
$1,822.11). - Evaluated Customers: Total count of active unified customer profiles under management.
RFM Behavioral Classification
Keystone automatically segments customers across a multi-dimensional Recency, Frequency, and Monetary (RFM) model:
| Segment | Criteria | Strategic Objective |
|---|---|---|
| Champions | Bought recently, buy often, and spend the most. | Reward loyalty, offer early VIP access, recruit brand advocates. |
| Loyal Customers | Buy on regular intervals with steady spend. | Cross-sell complementary product lines, promote subscription tiers. |
| Potential Loyalists | Recent buyers with above-average spend. | Deliver targeted onboarding journeys to drive secondary purchases. |
| New Customers | High recency, but low frequency (1 purchase). | Send educational product tips, establish relationship. |
| Promising | Recent shoppers who haven't spent substantial amounts yet. | Offer category discounts to increase order size. |
| Need Attention | Recency, frequency, and monetary scores above average, but slipping. | Reactivate with limited-time personalized incentives. |
| At Risk | Spent big money and purchased often, but haven't returned recently. | Aggressive win-back campaigns, surveys, customer support outreach. |
| Hibernating | Low recency, low frequency, low monetary value. | Low-cost email re-engagement or suppress from ad spending. |
12-Month Cohort Retention Heatmaps
Directly below the RFM breakdown, the Cohort Retention Heatmap tracks customer repeat purchasing over time.
- Rows represent customer acquisition months (e.g., Nov 2025, Dec 2025, Jan 2026).
- Columns represent subsequent months (
Month 0,Month 1,Month 2, ...,Month 12). - Cells are shaded dynamically: dark blue indicates strong retention (>40%), fading to pale gray for lower retention.
- Hovering over any cell reveals exact retention percentages, customer counts, and cumulative gross margin.
Dynamic vs Static Segments
Keystone supports two operational segment types:
- Dynamic Real-Time Segments (Recommended):
- Evaluated continuously as events arrive.
- Customers automatically enter a segment when they meet its criteria (e.g.,
last_order_date > 90 days agooradded_to_cart > 3 times without purchase). - Customers exit the segment as soon as they no longer qualify (e.g., after completing an order).
-
Synced continuously to external activation channels.
-
Static Snapshot Segments:
- Evaluated at an exact point in time.
- Used for historical audits, seasonal promotional baselines, or offline event attendee uploads.
Next Steps
- Learn how to build complex multi-condition cohorts in the Visual Query Builder.
- Review unsupervised clustering in AI Discovered Audiences.
- Sync cohorts to ad platforms with Marketing Activations.