Conversion Funnels & Step Drop-Off Analytics
Optimizing e-commerce conversion rates requires granular visibility into where prospective buyers drop off along the purchase journey. Keystone's Funnel Analytics engine tracks step-by-step progression across multi-stage customer flows.
1. The Conversions Overview
Navigate to Analytics -> Conversions (/analytics/conversions) to monitor macro conversion rates across primary business objectives.
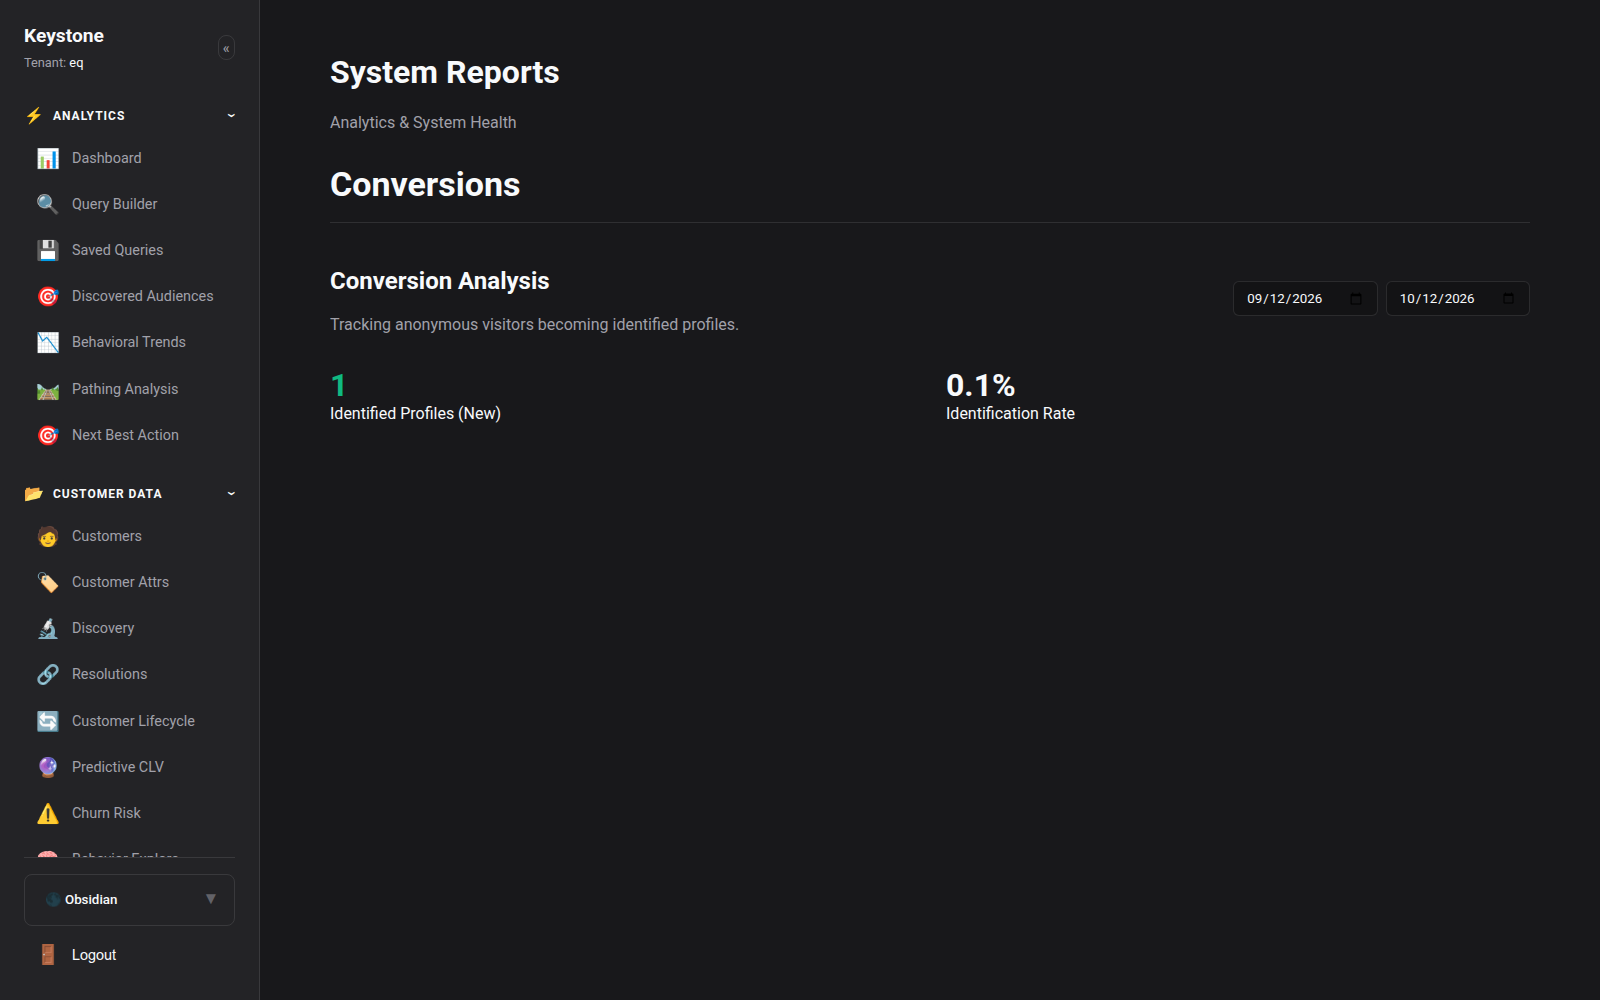
Key Metrics:
- Macro Conversion Rate: Overall percentage of unique visitors who complete a transaction.
- Micro-Conversion Milestones: Account registrations, email newsletter signups, wishlist saves.
- Conversion Velocity: Median elapsed time between initial session landing and final transaction completion.
2. Multi-Step Funnel Analytics
Navigate to Analytics -> Funnels (/analytics/funnels) to build and inspect multi-stage conversion funnels.
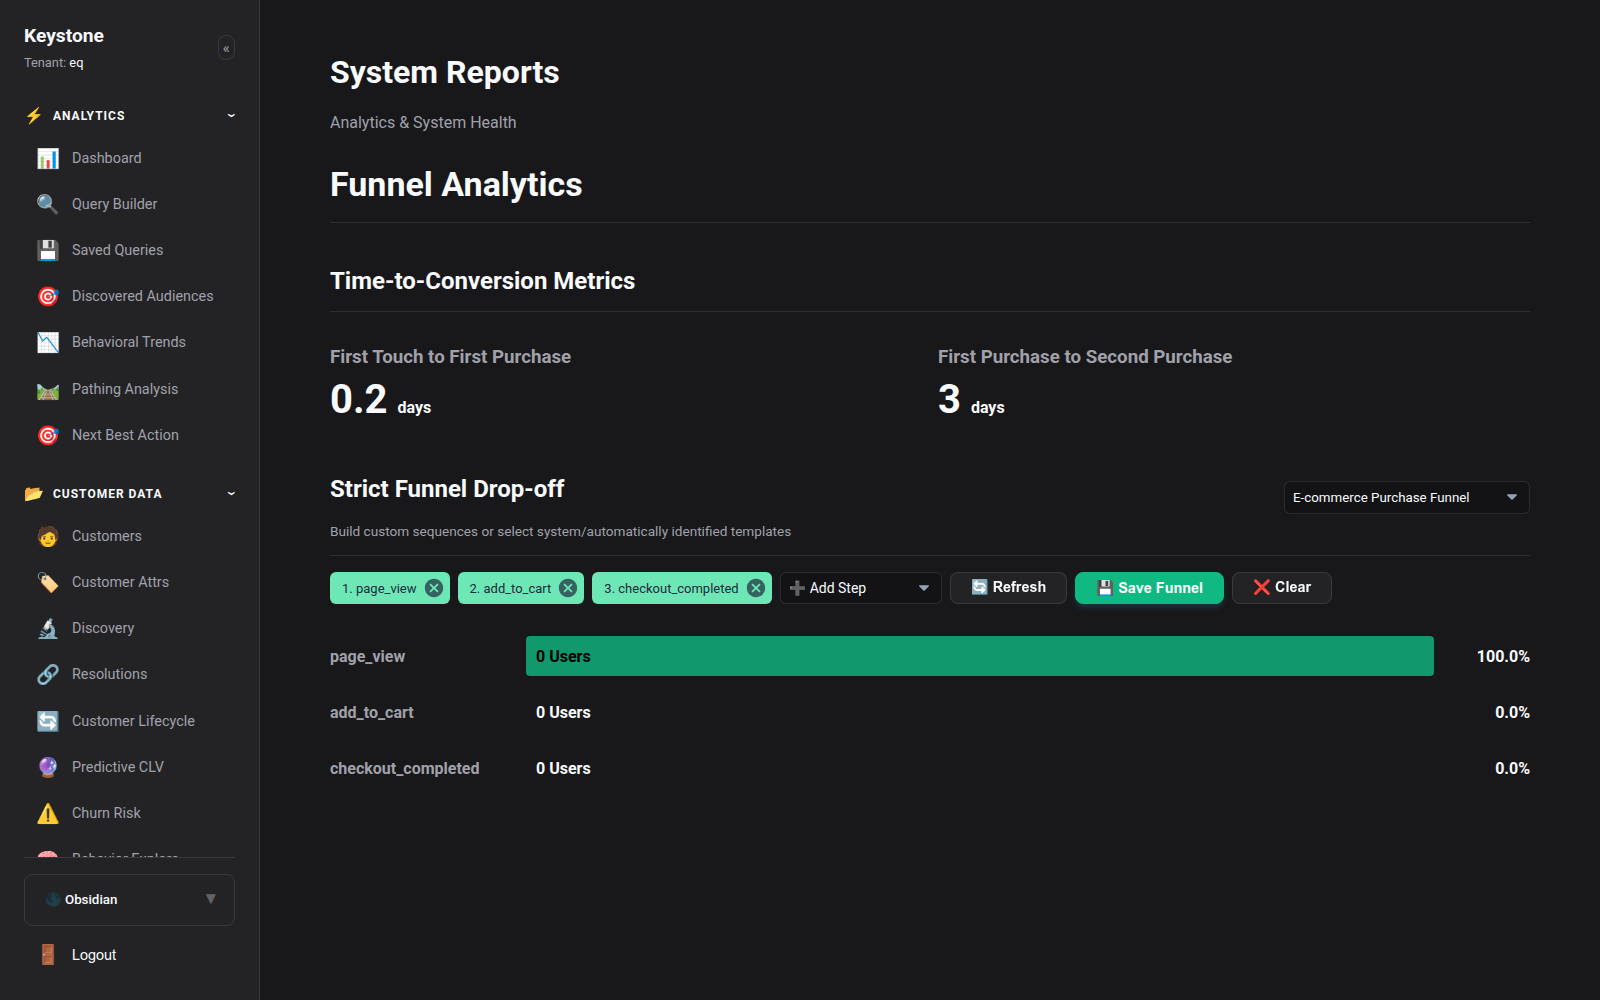
Standard E-Commerce Funnel Example:
- Step 1: Homepage / Landing Page View (100% - 25,400 visitors)
- Step 2: Product Detail Page View (64.2% - 16,306 visitors)
- Step 3: Added to Cart (22.8% - 5,791 visitors)
- Step 4: Initiated Checkout (11.4% - 2,895 visitors)
- Step 5: Order Completed (4.1% - 1,041 customers)
3. Segment-Level Funnel Comparisons
Funnel analytics becomes significantly more actionable when broken down by customer cohort: - Mobile vs Desktop: Compare checkout completion rates between mobile Safari and desktop browsers to identify mobile UX payment friction. - New vs Returning Customers: Returning customers often convert at 3x to 5x higher rates than first-time visitors. - Traffic Source: Compare conversion step drop-offs for Google Ads versus organic search traffic.